The Receiving End of the Blue Bin: A Map of U.S. Recycling That Follows the Waste
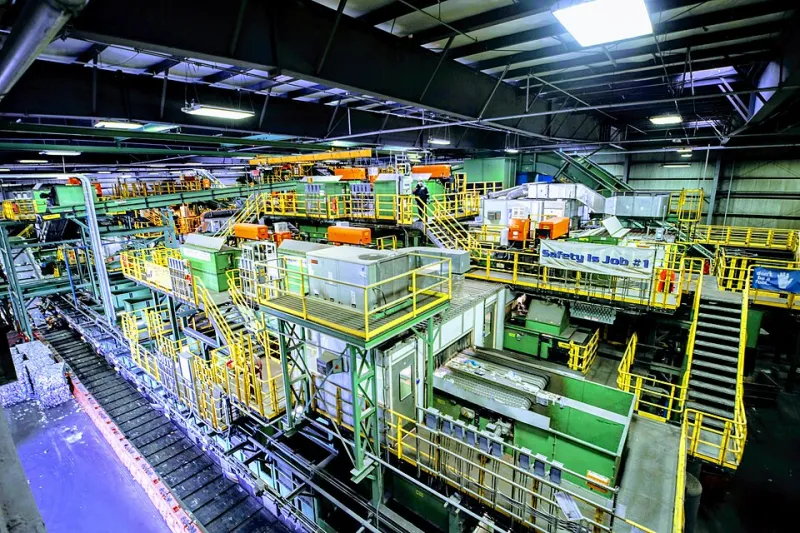
Photo: CaptJayRuffins, CC BY-SA 4.0, via Wikimedia Commons
The blue bin is one of the most recognizable symbols of environmental citizenship in the United States. It sits in kitchens and garages, receives rinsed jars and flattened cardboard, and disappears into a truck each week. But the bin is a starting point, not a destination. If U.S. recycling maps are going to mean anything, they should follow the material beyond the curb and show where it actually goes — including the communities that receive it, sort it, burn it, or bury it.
This column argues for a different kind of recycling map: one that tracks outcomes rather than intentions. The current emphasis on curbside participation and diversion rates can create a comforting impression that waste has been solved at the moment it leaves the driveway. In practice, recycling is a supply chain with sorting losses, contamination, market failures, export routes, and environmental burdens that are not distributed evenly.
The problem with counting bins
Many municipal recycling reports measure what is collected, not what is actually reprocessed. A city may announce a impressive diversion rate based on the tonnage picked up at the curb, even if a significant share of that material is later rejected at a sorting facility and sent to a landfill or incinerator. Contamination — food residue, plastic bags, tangled hoses, lithium batteries — drives up costs and reduces the value of the stream. Glass is heavy and often lacks local end markets. Mixed plastics can be difficult to recycle economically.
The result is a measurement gap. Residents are told to recycle more, but they are rarely told what happens to their material after the truck pulls away. That gap matters for public trust. If people knew that some of their carefully sorted waste was being shipped overseas or burned in a nearby industrial area, they might ask harder questions about the system itself.
Where the material actually goes
A meaningful map would begin with the local materials recovery facility, or MRF, where recyclables are sorted by equipment and by hand. From there, paper may travel to domestic mills or export terminals. Metals may go to scrap processors. Plastics may be sold to reclaimers, exported, or downcycled into lower-grade products. Glass may be crushed for road aggregate or sent to landfill if no local market exists.
The export story is particularly important. For years, the United States sent large volumes of recyclable paper and plastic to China. That trade changed sharply after China's 2018 National Sword policy tightened contamination standards, and subsequent restrictions in other countries reshaped the global waste trade. Some material has moved to other Asian nations, while some has shifted to Canada and Mexico. The Basel Convention's plastic waste amendments, which took effect in 2021, added new controls for certain shipments, though the United States is not a party to the convention. The details are complex, but the principle is simple: exported waste does not stop being waste when it crosses a border.
Receiving communities often bear the consequences. Ports, sorting yards, and disposal sites can generate air pollution, truck traffic, dust, and water contamination. When those facilities are located near low-income neighborhoods and communities of color, the recycling system becomes an environmental-justice issue, not just a consumer-behavior issue. A map that stops at the blue bin hides this geography.
A map worth building
Global Awareness Map's approach is to connect the visible consumer moment to the less visible infrastructure behind it. For recycling, that means layering several kinds of data: curbside collection boundaries, MRF locations and capacities, destination facilities, export terminals, residue disposal sites, and the demographics of host communities. It also means tracking violations, permits, and community complaints where that information is public.
Such a map would not need to be perfect to be useful. Even a partial picture would help residents understand that recycling is not a closed loop by default. It is a market system that requires stable demand for recycled materials, honest labeling, and accountability at every stage.
Questions to ask local officials
- What is our recycling rate after contamination and residue are subtracted, not just the amount collected at the curb?
- Where does our recyclable material go after it leaves the MRF? Which facilities, companies, and countries receive it?
- Who audits the destination facilities, and are the results public?
- What happens to glass, mixed plastics, and other low-value materials in our program?
- Are any recyclables being exported, and under what environmental and labor standards are they processed?
- How are communities near sorting facilities and disposal sites consulted about truck traffic, pollution, and safety?
- Does our contract with the recycling processor include penalties for sending collected material to landfill or incineration?
The consumer's role without the greenwash
Consumers can still make useful choices. Reducing waste in the first place matters more than perfect sorting. Knowing local rules reduces contamination. Supporting deposit-return systems and products with recycled content helps build domestic demand. But individual action cannot substitute for infrastructure and accountability. Residents should not be asked to carry the entire burden of a system whose destinations are hidden from them.
The blue bin is not the problem. The problem is treating it as the end of the story. A recycling map that follows the waste to its receiving communities would be less flattering and more honest. It would show where the system works, where it fails, and who pays for those failures. That is the kind of map informed citizens need — and the kind of questions local officials should be prepared to answer.